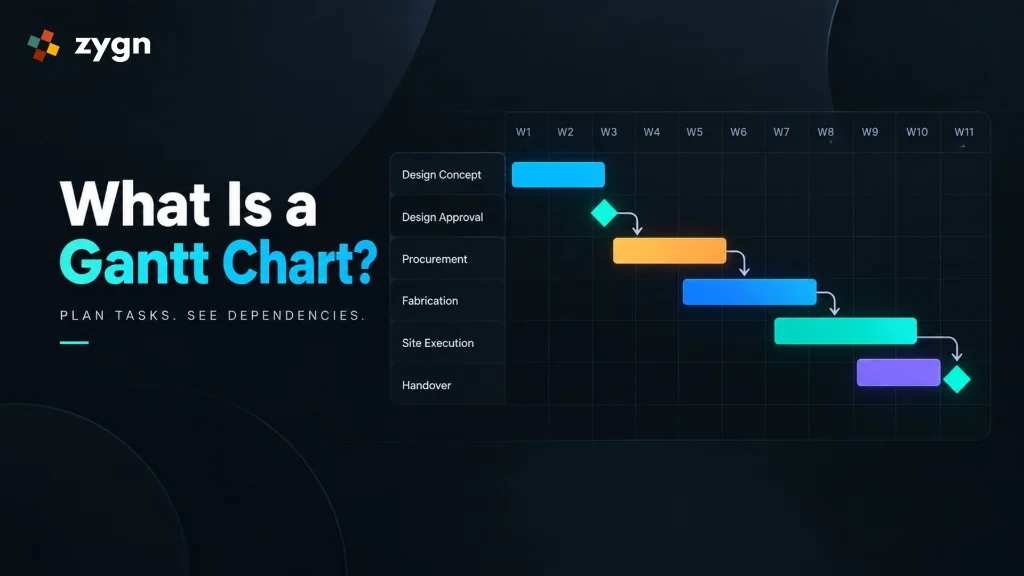
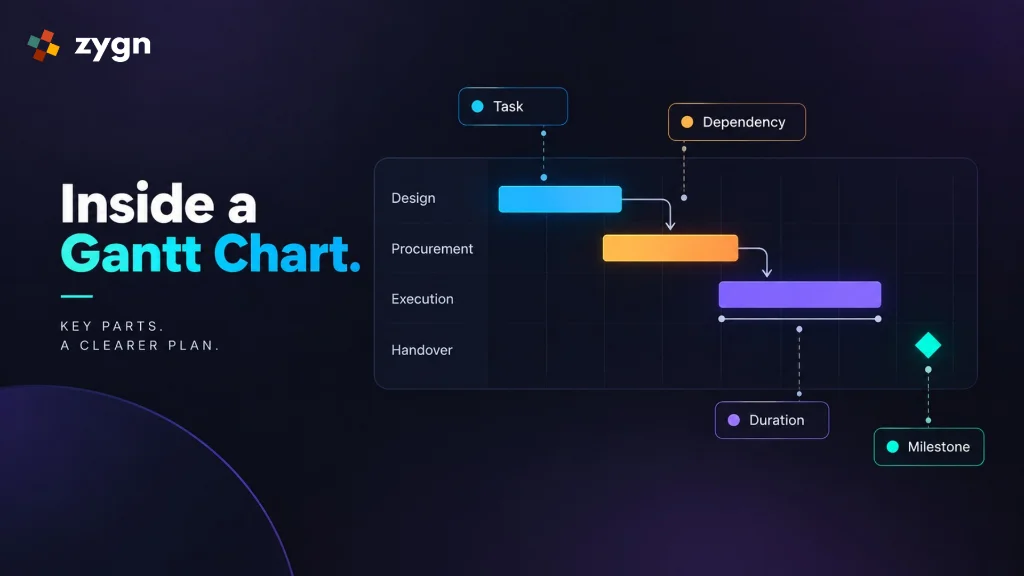
A Gantt chart is a horizontal bar chart that shows every task in a project laid out against a timeline - when each task starts, how long it takes, which tasks depend on others, and where the key milestones sit. It's one of the most widely used tools in project management because it turns an abstract schedule into something a whole team can look at and immediately understand.
The Core Elements of a Gantt Chart
Tasks & Subtasks
Each row on the chart represents a piece of work, which can often be broken down into smaller subtasks.
Start/End Dates
Every task is plotted as a bar spanning its planned duration, so you can see at a glance how long each piece of work is expected to take.
Dependencies
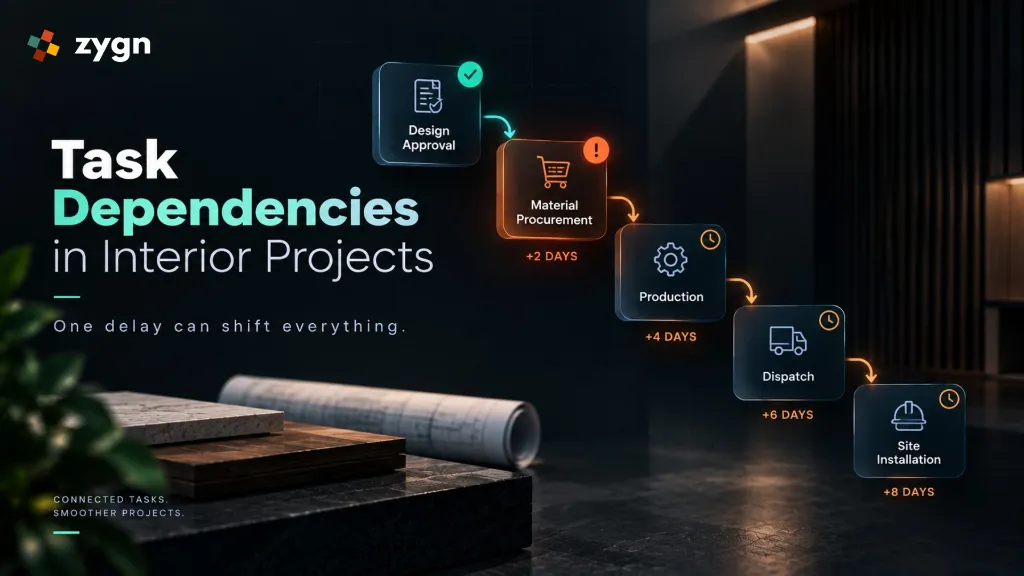
Lines or markers connect tasks that rely on one another - a task can't start until the one it depends on is finished. This is what turns a Gantt chart from a static picture into an actual planning tool: move one task, and everything downstream shifts with it.
Milestones
Key checkpoints - a design sign-off, a site handover, a final walkthrough - are usually marked distinctly from regular tasks, since they matter more to stakeholders than any individual task.
Progress / % Complete
Many Gantt charts shade each bar to show how much of a task is done, so status is visible without asking anyone for an update.
A Gantt Chart Example: Interior Design Project
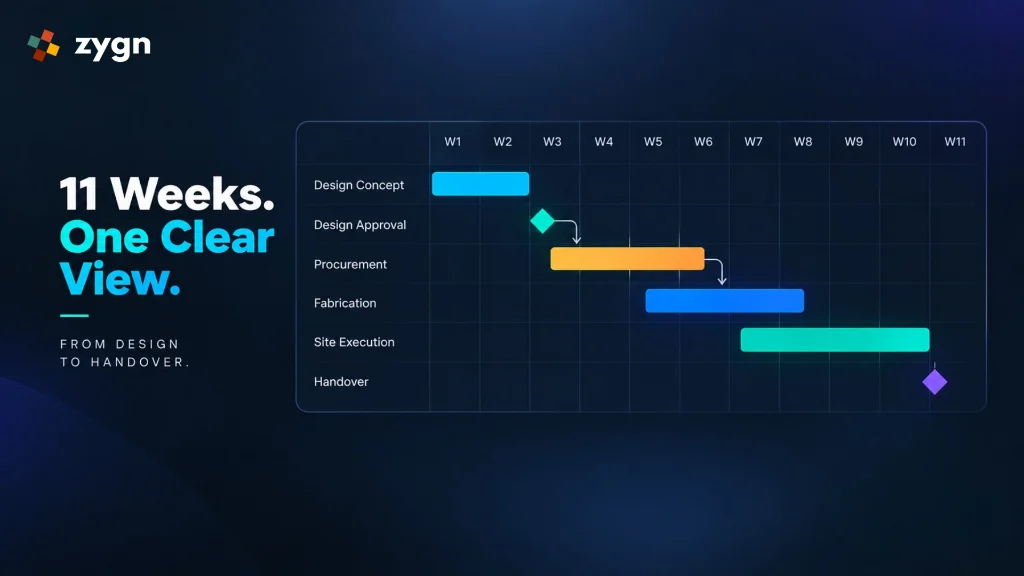
Picture a mid-sized interior fit-out. On a Gantt chart, you'd typically see: client brief and design concept (weeks 1-2), design approval - a milestone, since procurement can't start until it's signed off - material and furniture procurement (weeks 3-6, overlapping with fabrication once approved items are confirmed), site preparation and execution (weeks 5-10, dependent on procurement being far enough along), and final styling and handover (week 11) - another milestone. The value isn't any single bar; it's seeing instantly that if design approval slips by a week, procurement, fabrication and site execution all shift with it - which is exactly the kind of ripple effect that's easy to miss in a task list but obvious on a timeline. zygn's Gantt chart project management software is built to show exactly this kind of ripple effect automatically.
Gantt Chart vs. Kanban Board vs. Calendar View
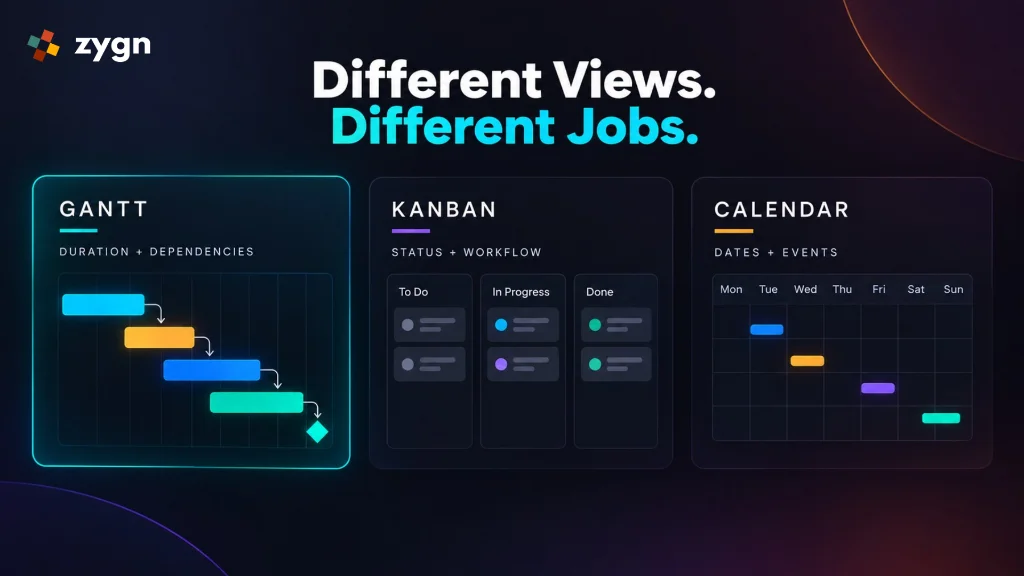
A Kanban board organizes tasks by status (To Do, In Progress, Done) rather than by time - good for tracking workflow stages, but it doesn't show you duration or dependencies. A calendar view shows what's happening on a given day, which is useful for scheduling but doesn't show how tasks relate to each other. A Gantt chart is the only one of the three built specifically to show duration, sequencing, and dependency together - which is why it's the standard choice when the relationships between tasks matter as much as the tasks themselves.
Benefits of Using a Gantt Chart
A Gantt chart gives a project team one shared view of what's happening and when, makes it immediately obvious when a delay in one task will affect others, and turns status updates from a conversation into something anyone can check by looking at the chart. For businesses running several projects at once, it also makes resourcing conflicts visible - two projects converging on the same install date, or the same vendor booked for overlapping jobs.
How to Create One (Manually vs. Software)
You can build a Gantt chart by hand in a spreadsheet, but it has to be manually rebuilt every time a task shifts, and it has no live connection to the rest of your project data. Gantt chart software automates the rebuilding - move one task, and dependent tasks shift automatically - and, in a connected project management platform like zygn, ties the chart to the same project, budget and procurement data your team is already using, so the timeline stays accurate without extra manual work.
Frequently Asked Questions
Who invented the Gantt chart?
The chart is named after Henry Gantt, an American engineer who popularized this style of chart in the early 1910s for industrial project planning, though similar chart formats existed slightly earlier.
What's the difference between a Gantt chart and a timeline?
A timeline typically just shows when events happen. A Gantt chart is a specific, more structured type of timeline that also shows task duration, dependencies, and often ownership and progress.
Can Gantt charts be used outside construction and manufacturing?
Yes - Gantt charts are used across software development, marketing campaigns, event planning, and any project where multiple tasks need to be sequenced and tracked over time. Interior design and fit-out projects are a natural fit given how many interdependent phases they involve.
What's a common mistake teams make when first using a Gantt chart?
Overloading it with too much granular detail right away - tracking every tiny task instead of the phases and milestones that actually matter. That makes the chart exhausting to maintain and, ironically, harder to read at a glance. Start broad, then add detail only where it earns its place.
How often should a Gantt chart be updated?
Ideally continuously, as tasks actually move - not just once a week in a status meeting. A chart that's only as current as the last manual update tends to quietly drift from reality, which is exactly the problem live, connected Gantt tools are built to solve.
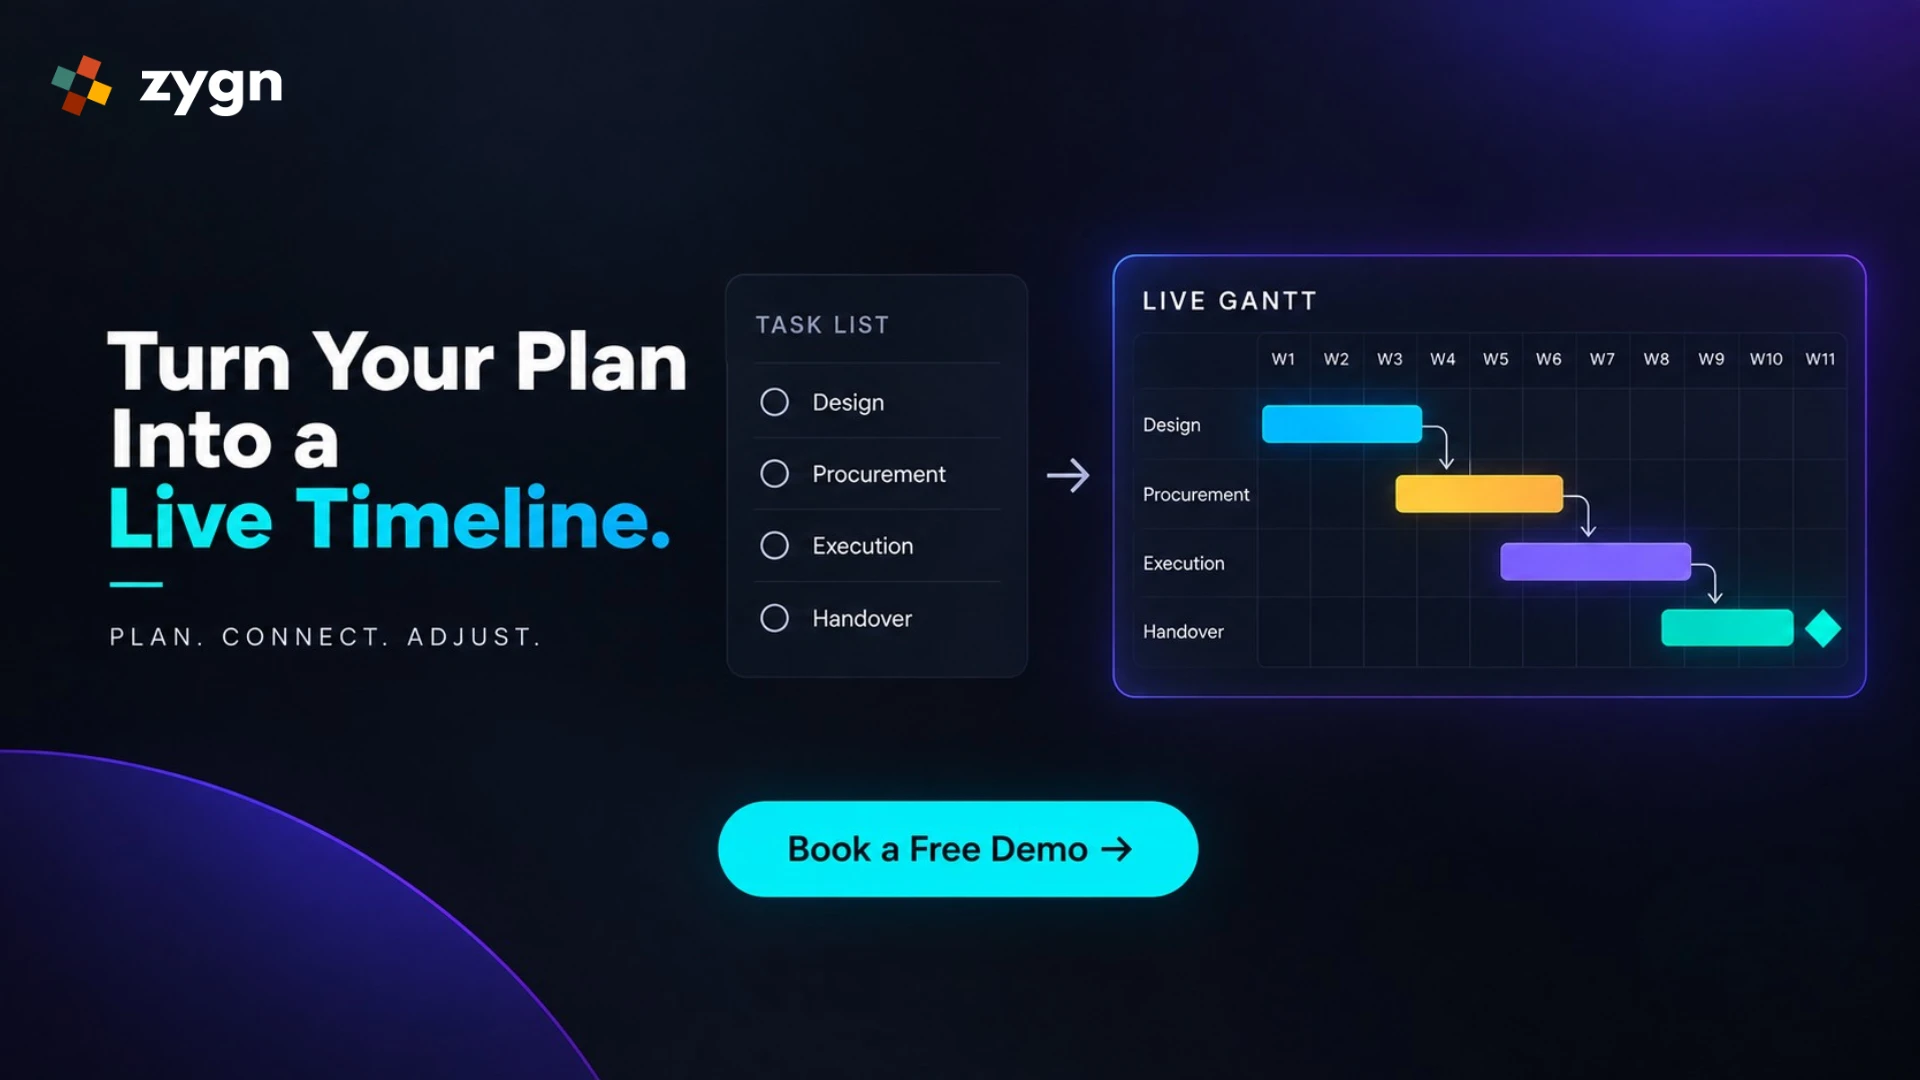
Try a live Gantt chart on your next project
Experience zygn's connected Gantt view - track timelines, dependencies, and site milestones in real time.
Book a Free Demo →